| About | News | Download | Help | nmichael.de |
|
Overview
|
||
Performance Data Analyzer (PDA) is a tool to analyze performance data and troubleshoot problems by correlating data from various sources. It comes with parsers for many common OS, Java, and database statistics, including parsers for vmstat, mpstat, iostat, collectl, Java garbage collection, and Oracle database statistics. PDA transfers data from these sources into internal time series. These series can then be plotted in a common graph, aligned to a common time axis and scaled individually. By interactively zooming in and out, different time periods can be analyzed in depth to identify or root-cause problems -- for example one curve spiking while another one drops. Series can be dynamically added and removed from the graph, grouped with other series, plotted in different styles, smoothed and scaled based on needs. The statistics function of PDA allows to calculate statistics such as minimum, maximum, average, variance or distance between samples for any of these data series, either for the entire time or any selected interval. The pluggable parser framework of PDA allows to easily add new parsers for other data formats.
If you are trying to find out why your application response times wen't up at 11:23:51, you might want to look at network throughput at your app and DB tier, ping latencies on your network interface, cpu utilization on your hottest interrupt cpu, average servicing times of a particular disk, and check whether you had any full garbage collections in your app tier at that time. Opening all these statistics files you've collected in an editor and trying to correlate timestamps manually to find out how things evolved over time is an extremely tedious thing. In fact, often you will not even spend the effort of doing it, but instead do some wild guesses what might have been the problem, tune some knobs here and there, rerun and see whether it happens again. But instead of using trial-and-error, you could thoroughly analyze the data you've collected and search for the important clues that allow you to identify the problem, or at least narrow it down. PDA is just the tool for that! It comes with parsers for lots of different formats and allows you to plot all these curves you think are important in a single graph. You can add and remove curves until you've found the ones that matter, align their scales appropriately, and zoom into that interval where your problem occurred.
Even if you don't want to troubleshoot a problem, you might need a tool to postprocess your data and calculate the total involuntary context switches of your mpstat data, the cpu time consumed by processes of a certain group, your average and maximum pause time for garbage collection, or the average I/O size for a subset of your LUN's. You can write a perl script to do that -- or you can use PDA. Your perl script may be able to do the math for entire file, but PDA allows you again to zoom into any time interval (your steady state, your peak load, ...) and calculate statistics for any interval of the data you might be interested.
Now that you have identified the problem, you would like to send others your analysis, or put the graph into a slide deck. And of course PDA allows you to save it as an image, annotated by labels you can put in there to explain all the spikes and drops for which you've figured out their root cause.
So what if you have data which PDA does not have a parser for? There are two possibilities: PDA provides a generic parser that can extract any data from a file which you specify as a regular expression. As long as the data you're interested does not stretch multiple lines, this parser can be configured to read any imaginable format. If that's not good enough, you can easily write your own parser and plug it into PDA. Once you understand how, writing a parser is a matter of half an hour to a few hours, depending on the complexity of the parser - and it's probably more powerful than writing the same parser in perl or awk, since you get all the plotting, aggregation and statistics for free. All you need to do is extract the data from the file and feed it into series provided by PDA. Data Correlation in PDA |
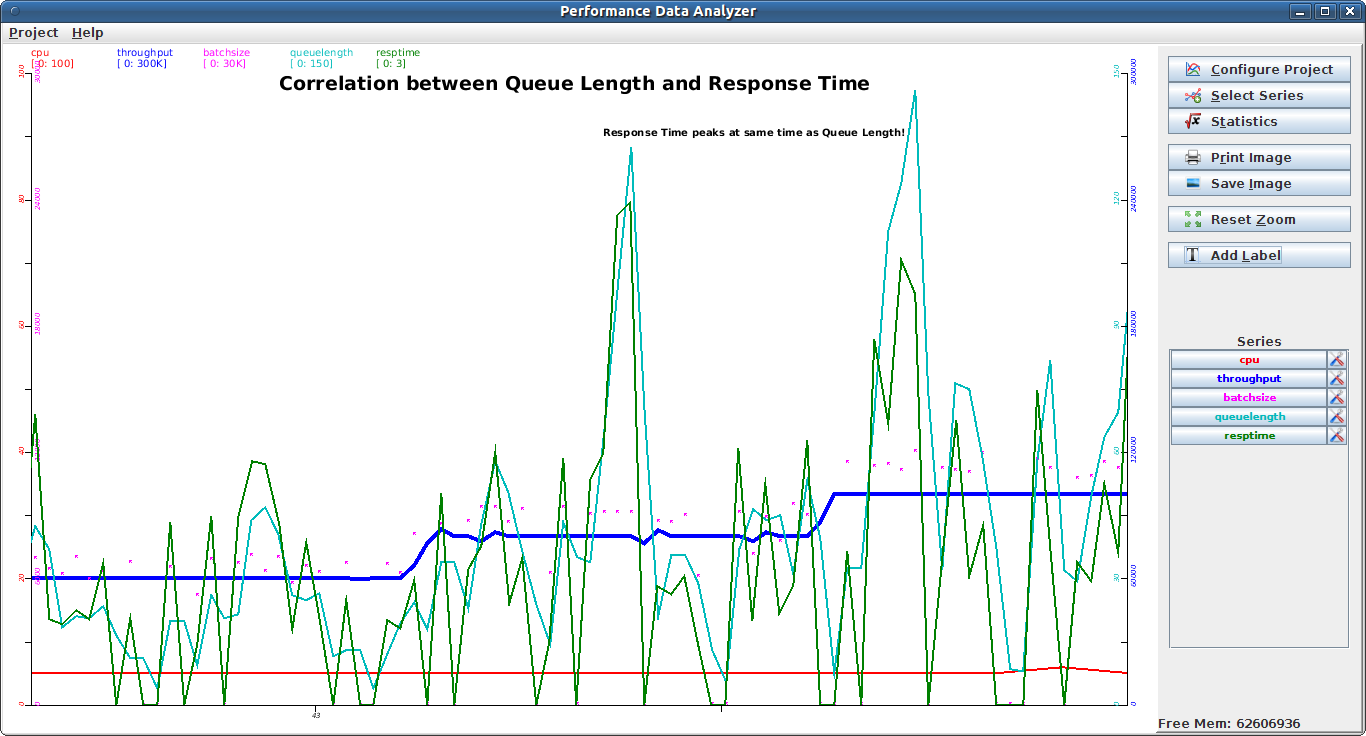 Data Correlation in PDA (zoomed) |
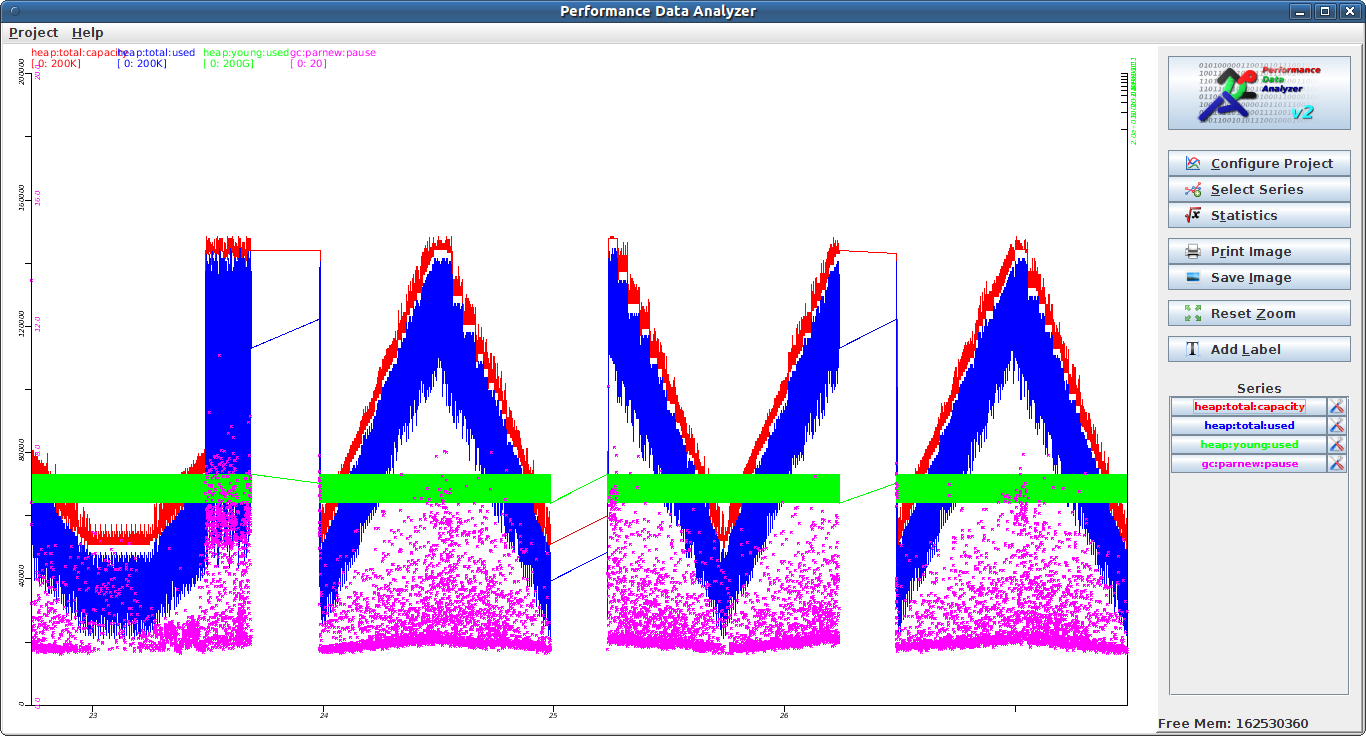 Garbage Collection statistics in PDA |
| PDA - Performance Data Analyzer • Copyright © 2006-18 by Nicolas Michael • Contact |